This Guy Makes Honest And Funny Charts That Sum Up Our Lives
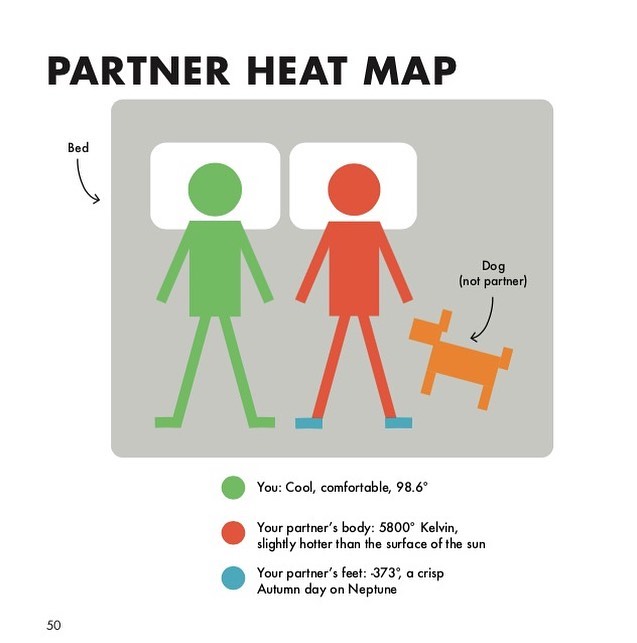
Matt Shirley is a legend, a visual genius, and a master of social insight. Odds are that you know of his work even if you aren’t aware of his name. Continue reading »
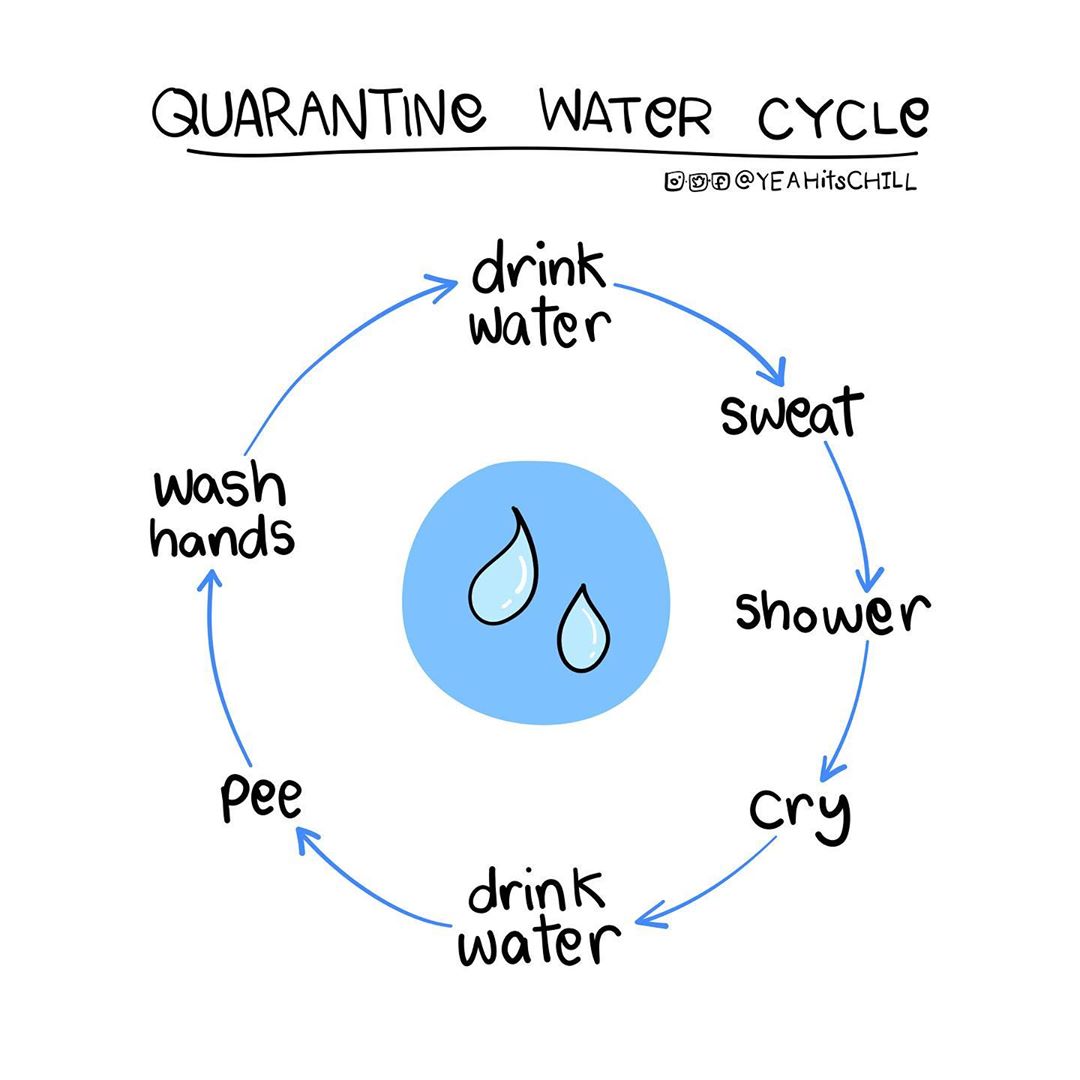
Funny And Relatable Charts About Everyday Life By Artist Irina Blok
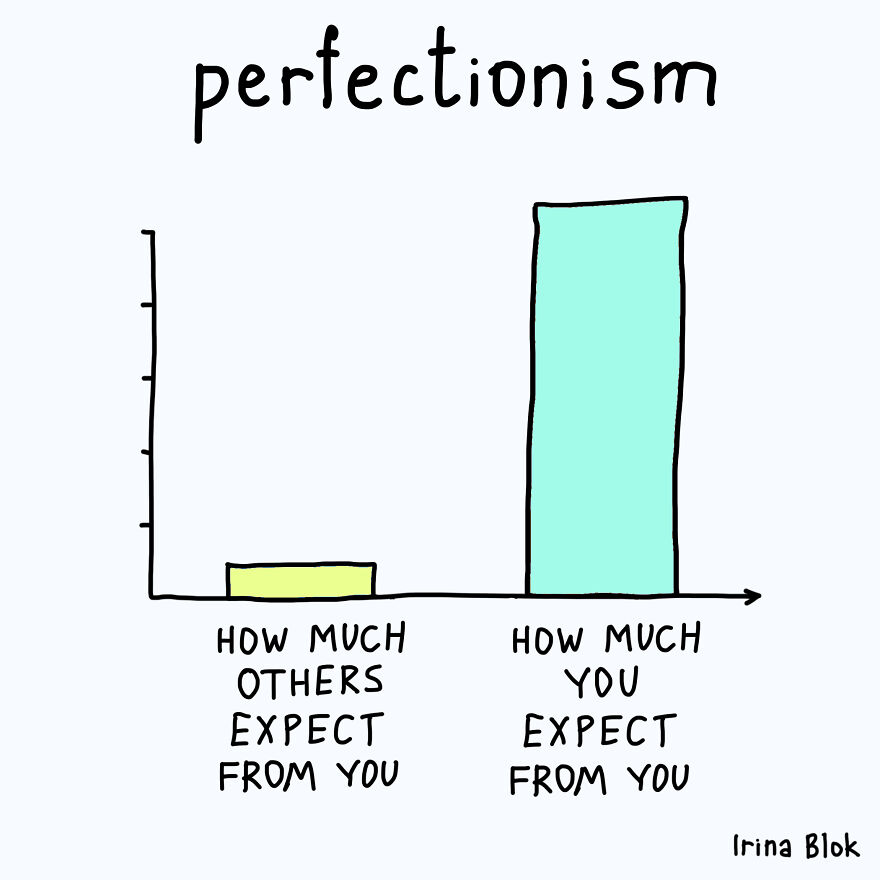
Irina Blok is a San Francisco-based designer who has been illustrating the ways COVID-19 changed our lives in funny “before and after” comics ever since the beginning of the pandemic. Recently, the artist created a series of charts illustrating people’s everyday lives, and they’re just as funny as they are relatable. Continue reading »
Unusual Maps People Shared On This Group That Might Change Your Perspective On Things
An Image Of GPS Tracking Of Multiple Wolves In Six Different Packs Around Voyageurs National Park Shows How Much The Wolf Packs Avoid Each Other’s Range
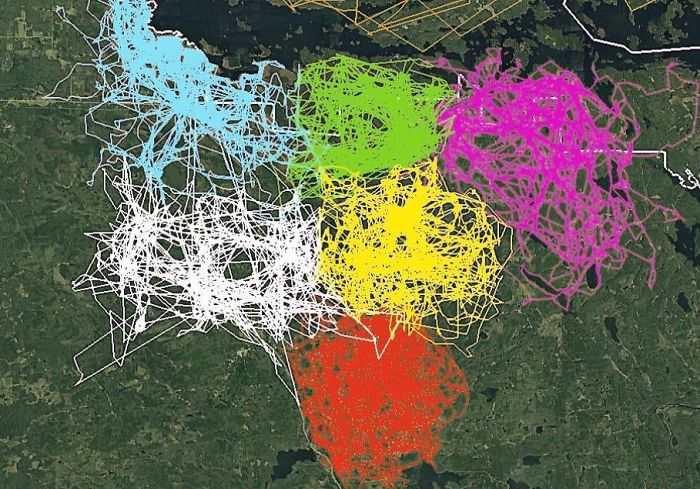
For many of us, cartography day in geography or history class meant a quick nap. With our eyes open, we’d dream of all the delicious stuff we were gonna eat after school, of music we’d play on the Walkman, of a message we received the other day from that cutie… Continue reading »
Christine Rai’s Comics Prove You Actually Can Make Art From Bad Tan Lines & Microaggressions
Take a break from the darker, sarcastic side of Instagram humor and cuddle up with some of Rai’s colorfully cute musings. Rai will definitely teach you something new every day, and sometimes those lessons will be difficult. But her artwork is sure to leave you feeling more powerful and validated than drained and worrisome. Continue reading »
Michelle Rial’s Real Life Charts
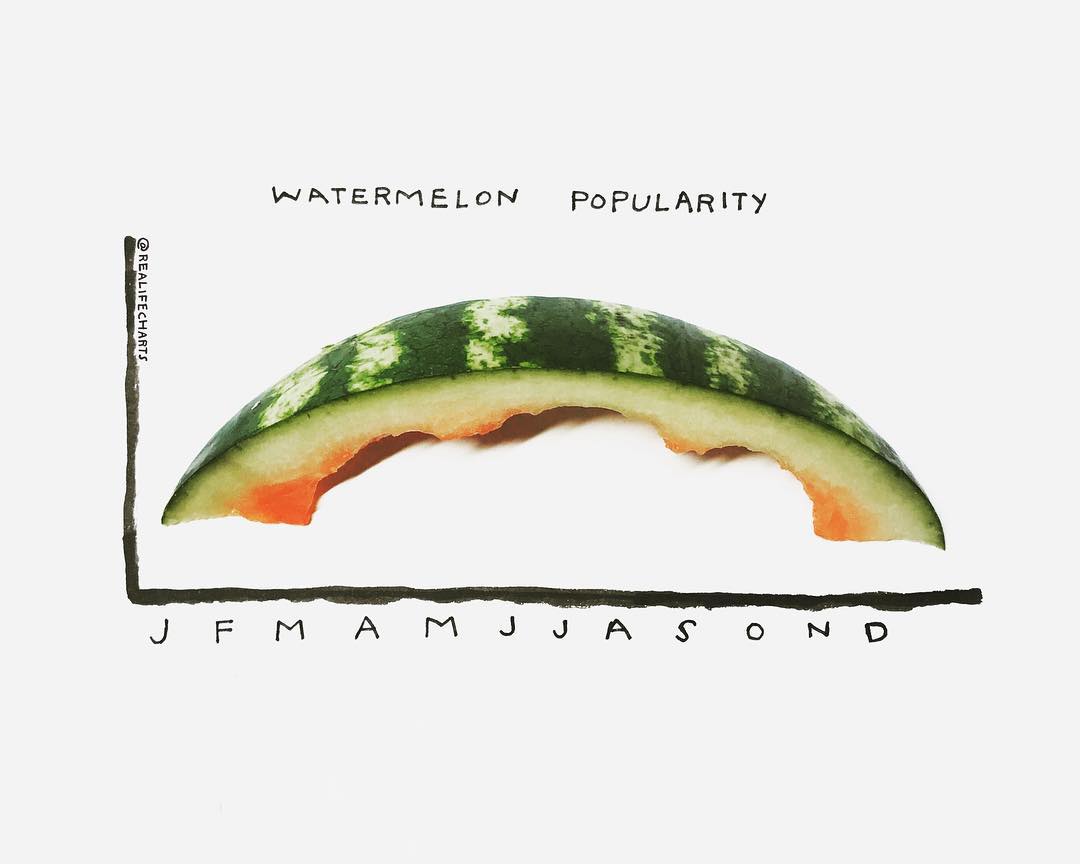
This graph made me laugh because Lent began last week and a friend said they were giving up watermelon. That doesn’t seem like much of a sacrifice in February. Michelle Rial is a designer who is really into charts. Some of her charts include real-life objects that illustrate the subject of the chart. Continue reading »
Assistant Professor Of Design Makes Honest Charts That Sum Up A Designer’s Life
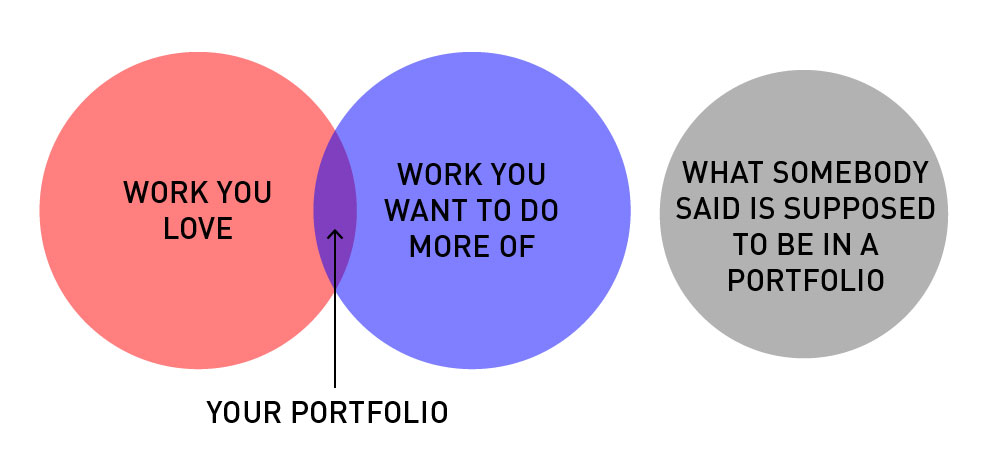
Mitch Goldstein is an Assistant Professor of Design at the Rochester Institute of Technology. When he’s not grooming budding artists at RIT’s College of Imaging Arts & Sciences, Mitch finds time to creates hilarious venn diagrams that accurately depict the problems faced by design students and professionals on a daily basis. Continue reading »
12 Charts That Perfectly Sum Up Being In A Long Distance Relationship
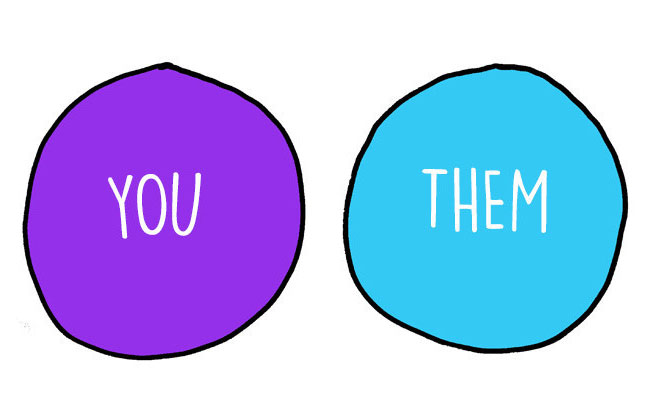
Image: Mikey Nicholson for BuzzFeed
Distance makes the heart grow fonder… um, no, actually it sucks. Continue reading »
Ben Greenman’s Museum of Silly Charts
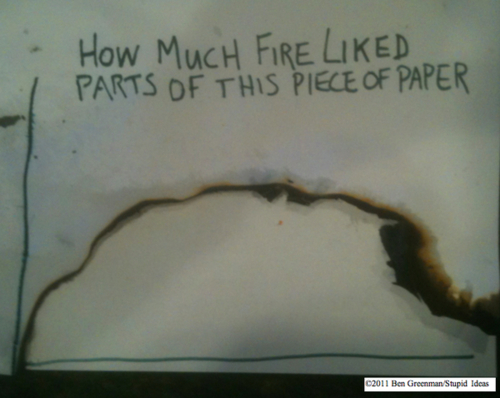
Ben Greenman is an author and editor at the New Yorker, who has been making infographics for an upcoming fiction project. Continue reading »